After a pullback in the third quarter, the stock market finished the year strong, with broad participation from several sectors of the market. We saw continued leadership of the Magnificent 7 Mega Cap technology-oriented companies (Apple, Microsoft, Alphabet, Amazon, Nvidia, Meta and Tesla) that dominated 2023. The market cap weighted S&P 500 Index finished the year +26.3%, while the equal weighted S&P 500 returned +13.9% for the year. The Dow Jones Industrial Average ended up +13.7% for 2023.
The bond market also rebounded from the prior year’s sharp decline. Interest rates, which had increased during the third quarter, retreated from their highs in early October on easing inflation concerns and a more moderate posture from the Federal Reserve. The benchmark 10-Year Treasury rate finished the year at 3.88%, the exact same level as it began 2023.
Economic Overview
For the last two years, much focus has been put on inflation and the response from the Federal Reserve. The inflation rate, while still above the Fed’s long-term target of 2%, has steadily declined since its peak in mid-2022. The Federal Reserve has suggested that it is near the end of its rate hiking cycle and may even start cutting interest rates, though the amount and timing is still uncertain.
As the attention shifts from inflation, much will depend on the trajectory of the macroeconomy. One surprise of 2023 was the resilience of the US economic growth. Despite aggressive Fed tightening of monetary conditions, increased geopolitical tensions and continued dysfunction in Washington DC, the US gross domestic product (GDP) exited 2023 at a currently estimated growth rate of +2.5%, about half the torrid +4.9% in the third quarter and roughly in line with the modest growth of +2.2% and +2.1% in the first and second quarters of 2023, respectively. Still affected by the lagging effects of tight Fed policy, GDP growth is currently forecast to slow down to +1.3% in 2024. Many economists suggest the potential for a mild recession sometime in 2024.
There are several indicators that are closely monitored to provide insight into the direction of the economy. One closely watched measure is the Institute for Supply Management’s Purchasing Managers Index (PMI), which tracks both the manufacturing and services sectors of the economy. The index is designed such that a score above 50 indicates economic expansion, while a score below 50 indicates contraction. Manufacturing activity continues to contract with a reading of 47.4 in December. It has been below 50 since fall of 2022, driven by pressures from input cost inflation, higher interest rates, and moderation in demand from the post pandemic surge. The services side of the economy is expanding slightly, with a 50.6 reading last month.
Another key element of the economy that has confounded many has been the resilience of the labor market. A well-known adage tells us if people have jobs, they will continue to spend and keep the economy going. Despite tight monetary policy, a slowing macro environment, and the drawdown in savings from Covid era stimulus initiatives, employment has remained strong, and has helped prop up the economy.
Wages have also increased, spurring growth but also contributing to inflation. There have been countless stories about employers unable to find workers to fill open jobs. This has been due in part to a decline in labor force participation in wake of the pandemic while demand has been robust, fueled in part by fiscal stimulus and accommodative monetary policy. This has resulted in record levels of job openings that employers have been struggling to fill, in particular at the lower end of the wage scale on the service side of the economy.
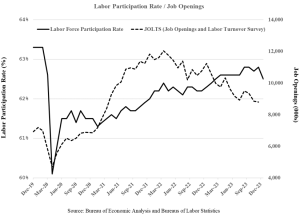
This imbalance in the labor market appears to be normalizing as well. The number of job openings has been declining steadily over the last year, with positions increasingly being filled by people rejoining the labor force. As shown below, the labor force participation rate has steadily increased since its April 2020 nadir, though it is still slightly below pre-pandemic levels. With this backdrop, the overall unemployment rate remains below 4%, very low by historical norms. This should provide some buffer to the soft landing that the Federal Reserve is trying to engineer.

Equity Market Overview
In the coming months, attention will increasingly be focused on the upcoming Presidential Election, which is likely to be very contentious. Except for periods of crisis, little substantive legislation occurs during Presidential Election years. This is especially the case when the government is divided, and we expect this year will not be any different.
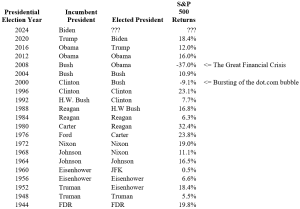
Given this backdrop, we thought it would be interesting to look back at how the stock market had performed in prior Presidential Election years. Since the end of World War II, there have only been two Presidential Election years (out of 20) when the S&P 500 was down for the year; 2000, when the dot.com bubble burst and 2008, during the depths of the Great Financial Recession. Incidentally, in both instances the incumbent party lost the presidential election. This compares favorably to the long-term average of a down stock market year roughly once every 4 years. The average return of the stock market in a presidential election year has been relatively consistent with its long-term average.


Another dynamic the stock market is currently wrestling with is to what extent declining interest rates have already been priced in. The equity markets are often viewed as a discounting mechanism that is pricing in the future. Much of the run-up in stocks in 2023 has been from growth stocks (led by the Magnificent 7), as declining interest rate expectations increase the value of future cash flows. Part of the strength in large growth stocks was a rebound from 2022, but much came from the expectations that inflation and interest rates had peaked and are likely to ebb going forward. Any change to this view could materially alter the market’s outlook.
Given these dynamics, it is informative to review the valuation of the broader equity markets again. Based on current consensus estimates for 2024, the S&P 500 is currently trading at about 19 times its forward price to earnings ratio (P/E). To put this into context, over the last few decades the S&P 500 has averaged trading at a forward P/E multiple of 16 to 17 times P/E. This implies that the S&P 500 is currently a little above its recent historical averages, which suggests that at least some expectation for easing of interest rates is being priced into the market.
However, as mentioned earlier, the S&P 500 has been led by the Magnificent 7 mega-cap technology-oriented growth companies that as a group are trading at 33 times a weighted average of their forward P/E, and with expected earnings per share (EPS) growth of 19% over the longer term (3-5 years). These 7 companies constitute almost 30% of the market cap weighted S&P 500, and whether they can sustain that level of expected earnings growth will determine if they are able to maintain their valuation premium. The implication is that the remaining 493 companies in the S&P 500 are trading at 14 times forward P/E, which is not expensive by recent historical norms, long-term historical earnings per share growth of about 10% and current interest rate levels. While the Magnificent 7 are terrific companies with strong balance sheets and exciting growth prospects, we continue to remain careful of any excess concentration and exposures.
Fixed Income Market Update
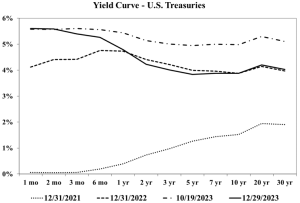
One reason it is wise to avoid concentrations is the uncertain future course of interest rates. Interestingly, if one did nothing but compare rates at the beginning and end of 2023, one might think the year was eventless. As is quite noticable in the yield curve graph on the next page, yields on treasury bonds of all maturities greater than 2 years began and ended 2023 at about the same level. Better perspective is gleaned by focussing on the other two lines we included, mapping the yield curve at the end of 2021 and again this past October 19, the day rates peaked.

Viewing the move from 12/31/2021 to 12/31/2022 we see the vast rise in rates engineered by the Federal Reserve to fight inflation. Prices of outstanding bonds plummeted, much like many growth stocks dependent on future earnings as discussed earlier. In 2023, rates stablilized early on, but then rose from midyear to mid-October as progress on inflation stalled, wage increases accelerated, and GDP heated up. Thereafter, bond market participants reacted to increasingly benign price data and more tempered economic activity, allowing longer rates to fall back to their year-starting levels. Howerver, the Fed has not yet declared victory, rendering a yield curve that is still inverted, with short-term rates about as high now as they were at the October peak.
Within balanced and purely fixed income accounts, we continued our shift toward short treasury bonds and bills, partly to maximize yields but also to remain tactically flexible. If/when rates fall upon Fed success, short-term yields will be driven down, but long term yields will likely remain near current levels. We will be able to secure better yields reaching out to long maturities at that point. If news is disappointing and rates do not come down, we will be thankful we did not extend and thereby grab better yields where most opportune.
Further, we are keeping tabs on new pressures brought on by rates that are generally higher than they have been in fifteen years. As old low-interest bonds mature and need to be refinanced, new high-interest rate bonds replace them. Meanwhile added borrowings necessitated by government deficits are also issued at these higher rates. Highly leveraged firms may become weaker credits due to the heightened financial strain, while the expanding supply of new government debt may find weak demand at future auctions. Each of these forces would cause rates to rise, perhaps fostering a spiral effect as rate increases fuel the causes of further rate increases. We want to be prepared.
