The stock market got off to a strong start to the year with the market weighted S&P 500 increasing 10.56%. But as was the case for much of last year, the performance was primarily concentrated in the large technology-oriented growth companies. By comparison, the equal weighted S&P 500 was up 7.91% for the quarter. Other segments of the stock market were also positive, but not to the same level. The S&P 600 Index of small cap stocks was up 2.46% and the Dow Jones Industrial Average rose 6.14% over the same period.
Meanwhile, the bond market continued the modest rollercoaster pattern we witnessed last year, with rates rising on disappointing inflation reports, and falling back down upon more sanguine news. Recent economic data suggests that inflation may not be entirely contained, so expectations for Federal Reserve rate cuts have been reduced in terms of number and delayed in terms of timing. In reaction, the markets pushed the yield on the benchmark 10-Year US Treasury from 3.88% at year-start to 4.20% at quarter’s end.
Economic Overview
After a year of moderating inflation, there have been increased hopes that the Federal Reserve had achieved its goldilocks scenario in which inflation is contained without forcing the economy into recession. Despite the increase in interest rates over the last 2 years, the economy, led by a strong jobs market, has continued to remain resilient. Gross domestic product (GDP) expanded at a healthy 3.4% pace in 2023’s last quarter, and the rate of inflation was lower than the year prior.
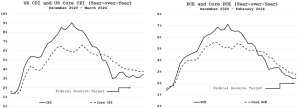
Still, prices are rising faster than the Federal Reserve’s long-term target of 2%. As we see in the charts on the following page, inflation as measured by the Bureau of Labor’s Consumer Price Index (CPI) has remained stubbornly above 3% for the last nine months. Similarly, the Federal Reserve’s preferred gauge of inflation, the Personal Consumption Expenditures Index (PCE), which did not rise as much as CPI during the peak days, is now leveling off at levels above the Fed’s long-term target.
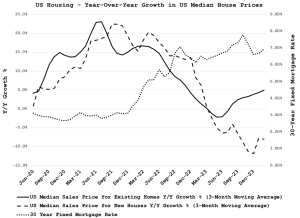
There are other indications the battle with inflation may not be completely over. Oil prices, which had declined in the fourth quarter of 2023, rebounded 13% in the first quarter of this year. And housing prices, which have been a significant driver of inflation, have exhibited continued strength despite higher mortgage rates. For reference, housing is currently about a third of the CPI Index and almost a fifth of the PCE index. As seen in the chart below, housing prices – especially for existing homes, which comprise well over 80% of total homes sold in the US – have seen renewed vigor in pricing in the last few quarters. This strength is occurring even as mortgage rates remain close to levels not seen since 2001.
Thus, the Federal Reserve is taking a wait and see approach towards its decision on cutting interest rates. This stance is supported even further by a backdrop that includes a resilient labor market, strong equity market performance, and potential speculative froth in some asset prices. An example of the latter is cryptocurrency, led by Bitcoin, which increased 65% during the quarter. At the beginning of the year, the market had begun to price in six interest rate cuts, starting this spring. Now, predictions are quite variable, with some thinking three cuts are on the way, beginning in summer, to others who believe there will not be any cuts this year.
We will, of course, continue to closely monitor trends and newly reported data to gain insight into the potential future direction of the economy and Federal Reserve monetary policy.
Equity Market Overview
Given the recent robust performance of the equity markets, in particular large capitalization technology-oriented growth stocks, we thought it would be instructive to put the current equity market valuation in historical context. We do such looking at current equity valuation levels, but also at how historically the stock market has performed in subsequent periods.
As shown in the chart below, the S&P 500 is currently trading above its long-term (70-year) historical average. As we see in the chart below, when the S&P 500 is above its long-term average, in subsequent periods it has continued to perform well. It outpaced both the then-current interest rates and inflation. However, not surprisingly, in the longer term, returns were better following times when the S&P 500 was trading at lower valuations.
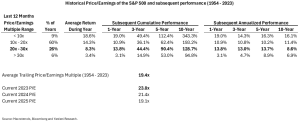
It is important to note that despite the higher-than-average overall valuation of the S&P 500, much of that has been driven by the largest technology-oriented growth stocks, popularly referred to as the Magnificent 7 (Microsoft, Apple, Nvidia, Amazon, Alphabet (Google), Meta (Facebook) and Tesla)). If we exclude the Magnificent 7, the remaining 493 companies of the S&P 500 are currently trading in line with historical averages.
Fixed Income Market Update
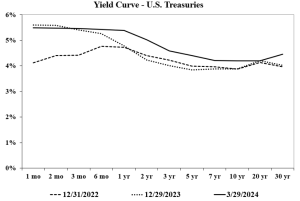
As mentioned earlier, the fixed income market remains at similar levels with similar influences as we observed last year. Thus, it should not be shocking that we continue with the same tactics that have served us well over the past few years. In balanced and fixed income accounts, we have put emphasis on very short treasury bonds and bills, most maturing in less than a year. These presently yield more than longer-term bonds, bank CDs, and most corporate bonds, while they provide the best safety and liquidity. The latter attribute will be helpful when it becomes advantageous to shift gears.
Still, as we scour markets daily, some very high quality corporate bonds come to market at yields that allow us to lock in higher rates for longer spans than available in treasuries. We add these on occasion in a prudent manner, and even in this sector we are reticent to invest in anything maturing more than two years out. There will come a time when longer rates exceed short rates, and when corporate bonds present yields in excess of treasuries worthy of a broader rotation toward that sector. But now is not the time.