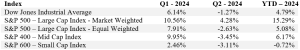
The stock market was mixed in the second quarter. Most broad market indices declined during the quarter except for the market-weighted S&P 500, which was propelled by only a few mega-cap technology-oriented companies. The performance of these giants was fueled by the excitement over artificial intelligence (AI), both traditional AI which focuses on processing data for analyses or predictions, and generative AI through which new content is produced from existing data. A summary of the quarterly and year-to-date returns of the various broad stock market indices is below.
The bond market is still closely monitoring inflation and Federal Reserve policy. With higher-than-expected interim inflation readings, rates rose just slightly during the quarter. The 10-year treasury finished the quarter at 4.36%, up a smidge from 4.20% at the end of March. In bond and balanced accounts, we are garnering about 5.3% on short treasuries and a bit above that on solid 2-year corporates.
Economic Overview
The economy continues to progress at a modest pace. US real GDP growth slowed to +1.3% in the first quarter after averaging +3.1% growth in 2023. The Federal Reserve Bank of Atlanta is now estimating that GDP growth rebounded to +2.7% in the second quarter. Broader market estimates for GDP growth for the full year are centered around +2.5%. Inflation continues to remain above the Federal Reserve’s long-term target. This is largely a function of housing prices. Inventory in this sector is growing, so pressure on prices should ease. In the charts below you might note the improvement in the year-over-year rates of inflation since 2022 but also the recent stall in the decline in inflation as measured by Consumer Price Index (CPI). The Fed pays more attention to the Personal Consumption Expenditures Price Index (PCE), but it shows the same pattern.
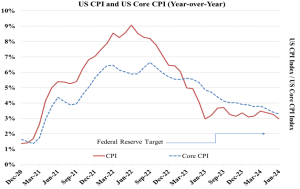
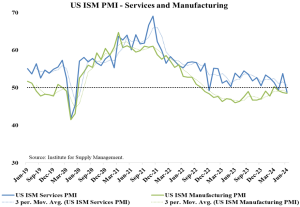
Despite the stall, it is noteworthy that prices increased only 1.4% during the first six months of this year, and they have been flat for the last two months. Reacting, markets have shifted expectations for the next Fed interest rate cut from year-end to as soon as September. Meanwhile, prospects for economic growth remain modest. Measurements from the Institute for Supply Management’s Purchasing Managers Index (PMI) continue to show a slightly growing service sector and a slowly contracting manufacturing sector. In the chart below, a reading above 50 indicates expansion; below 50, contraction.
Taken together the economy appears to be crafting the soft landing that the Federal Reserve has been aiming for. Of course, nothing is certain. Moreover, after recent events, no matter who wins the election, there will be a change in the White House and with it some changes in policy. We will, of course, continue to closely monitor events, trends, and data to maintain prudent exposures to capitalize on opportunities and limit undue risk.
Market Overview
As previously mentioned, equity market performance has recently been characterized by an extreme level of concentration. This has primarily been driven by the excitement and in some cases, frenzy surrounding the prospects for artificial intelligence. Growth has been very rapid in this area, and the difficulty is judging how sustainable that level of growth is. Using the S&P 500 Index as a measure of the 500 largest US stocks by market capitalization, we see that the three largest companies alone now comprise over 20% of the entire market-weighted S&P 500 Index. The five largest companies account for about 30% of the value of the index. These five firms account for only 1% of the companies in the S&P 500 Index. We do not believe it is prudent to tie your whole portfolio to the fate of five stocks, especially when they are all technology-oriented, and in part driven by the same theme. So, we maintain a disciplined approach and diversify appropriately.
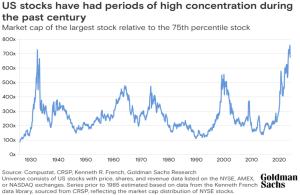
To put the current valuation levels in a broader context, the three largest companies in the S&P 500 Index alone (Microsoft, Apple and Nvidia) have a combined total market capitalization of about $10 trillion, which is roughly the size of the entire Chinese stock market of over 6,000 companies, or about the same market capitalization of the entire Japanese and Indian stock markets (the third and fourth largest stock markets in the world) combined. One might also consider the historic relationship between the value of the largest company relative to the broader market, as shown below.
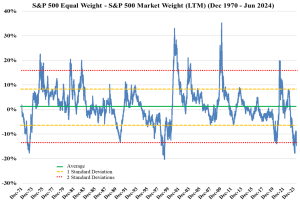
One way of examining this concentration of stock price returns is comparing the market-weighted S&P 500 returns to those of the equal-weighted S&P 500. Looking at data going back to 1970, we see that the equal-weighted S&P 500 has outperformed the market-weighted S&P 500 by 1.3% annually (12.3% vs 11.0%). However, there are periods when the performance of a few large firms can dominate the index.
In the chart below, we examine twelve-month returns (labeled LTM for “last twelve months”) of the equal-weighted S&P 500 minus the market-weighted S&P 500. We see that the relationship is currently more than two standard deviations below its historical average. In simple language, the magnitude of recent outperformance of so very few names occurs less than 5% of the time…once every 20 years or so. Since 1970, there were two prior periods in which there were such large deviations. In the early 1970s, at the height of the Nifty-Fifty craze, investors flooded into the largest companies, believing they would grow forever and according them very high valuation multiples. In the late 1990s, at the peak of the dot.com/technology bubble, there was significant excitement around the prospects for the internet. In both cases, the mania ebbed, prices reversed, and markets normalized.
While we are not suggesting that this trend will not continue, or that the largest technology companies do not have terrific businesses, or that AI will not be a big future development, we are mindful of the risks entailed in high valuations and concentrations. As we diligently monitor the markets and your investments, we once again highlight our role as a resource for you and your family to freely tap for holistic financial guidance. From broad financial planning to more focused efforts such as estate or retirement planning, we welcome the opportunity to be of service.
We thank you for the opportunity to serve.