After a period of concentrated equity returns that were led by the largest mega-cap technology-oriented companies, the stock market saw broadened participation in the third quarter. A summary of the quarterly and year-to-date returns of the various broad stock market indices is below.

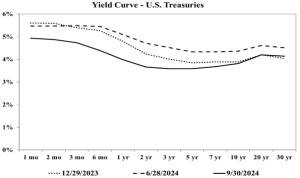
Meanwhile, interest rates dropped across the board, as you can see in the following chart:
Economic Overview
The major development during the third quarter was the Federal Reserve’s September decision to start cutting its target interest rate by 0.50%, ending a rate hiking cycle that began in March 2022. Inflation readings during the quarter confirmed the continued moderation as the Federal Reserve appears to have engineered its much sought after “soft landing”.
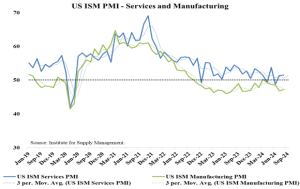
Parts of the macro-economy have continued to show some signs of slowing. As shown below, manufacturing activity as measured by the Institute for Supply Management’s Purchasing Manager’s Index (PMI) has been in a state of slight contraction for about two years while the services economy remains slightly expansionary.
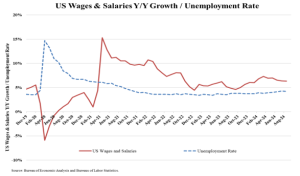
The easing of inflationary pressures is allowing the Federal Reserve to focus on its other stated mandate, promoting full employment. Wages were one of the main components that was driving overall inflation. As shown in the chart below, year-over-year growth in wages surged into double figures in 2021 but since late 2022 has settled just above 5%. Over the same period, the unemployment rate dipped to a record low 3.4% in 2023 but has since started to tick up, reaching 4.1% as of the end of September.
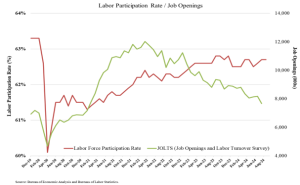
Further pointing towards the easing of wage pressure is the number of job openings, which continues to come down, while the labor for participation rate remains steady.
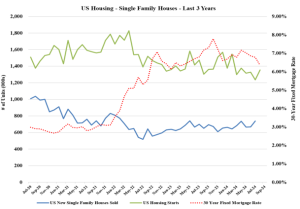
Housing has been the other significant driver of inflationary pressures. As we see in the following chart, despite higher interest rates, new housing starts as well as new single-family home sales have remained relatively consistent.
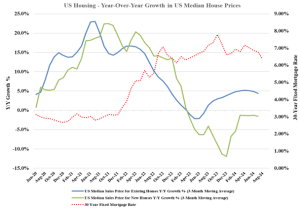
At the same time, the rate of growth of median US home prices has moderated from the Covid peak.
Taken together, we are experiencing a stable, modestly growing economy with easing inflationary pressures. But there is always the chance this benign environment can be derailed, whether due to the upcoming presidential election, heightened geopolitical tensions or even extended labor strikes that threaten key parts of the economy.
Market Overview
Presently, there are many factors impacting the outlook for the equity markets. On the one hand, returns have been strong for the last couple of years, valuations have increased meaningfully, there is much uncertainty emanating from the upcoming presidential election, and global tensions are elevated, all which would point to a more cautious approach. On the other hand, the economy, while showing some signs of slowdown, appears resilient with the most recent quarterly GDP growth estimates coming in at +3.0%. Supporting a positive outlook, the Federal Reserve’s shift towards lower rates and easing monetary pressure should provide some tailwinds to growth and the market.
Given this backdrop, we thought it would be instructive to put the current market valuation in context.
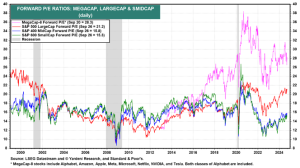
First, it is important to separate the mega-cap stocks into their own category, as their performance, and perhaps notoriety, have developed unique aspects. There are now eight firms included in what is referred to as the “Magnificent 8”. In order of current size, they are Apple (AAPL), Microsoft (MSFT), Nvidia (NVDA), Amazon (AMZN), Alphabet aka Google (GOOGL), Meta aka Facebook (META), Tesla (TSLA), and Netflix (NFLX). In the following chart you can see how in the last few years the valuation of these mega-cap stocks has separated itself from other large-cap, mid-cap and small-cap stocks.
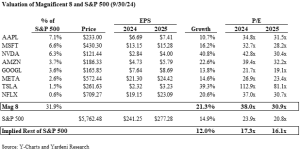
Part of this disparity is due to higher expected growth. In the chart below we show the expected growth and relative valuation of the Magnificent 8 as of the end of the third quarter and compare it with the anticipated growth and implied valuation of the remaining companies in the S&P 500. The lower figures for the latter are more in-line with historical averages.
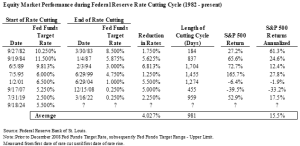
Given the Federal Reserve’s shift to a rate cutting cycle, we also thought that it would be instructive to look at prior rate cutting cycles. Not surprisingly, except for the Great Financial Crisis of 2008/09, Federal Reserve rate cutting cycles have generally been positive for stock market returns, as easing monetary conditions usually provide a tailwind to economic activity.
Even here, in the realm of yields and fixed income, there are countervailing forces. You may recall how in 2022 rates went up across the board. Many investors holding intermediate and long-term bonds and bond funds lost much money. We kept maturities very short in advance and netted positive returns. Bond are not one monolithic market but instead present characteristics such as maturity and credit quality that can exhibit dramatically different behaviors.
As mentioned earlier, the Federal Reserve cut its target for the Federal Funds rate by 0.5%. Between our last letter and this one, the rate on a 6-month Treasury bill is lower by more than 1% while the rate on a 30-year Treasury bond is down only a fifth of a percent. The Fed will likely continue the downward course for short-term rates, but stronger economic growth, fear of inflation reaccelerating, and massive increases to the supply of bonds due to burgeoning government deficits may keep upward pressure on longer-term rates. It is interesting that mortgage rates, which had fallen almost 2% since their peak about a year ago, have reversed course and started rising again since the Fed rate cut.
Briefly, Fed policy intentions should be benign for the economy and markets, and the election will end, taking out one aspect of uncertainty. But much more is happening, and we will continue to be diligently aware, analytical, and prudent.
